We engineer data solutions
We are a team of analysts, researchers, software developers, data engineers, and R enthusiasts. We create custom data solutions for analysis, visualization, and reporting.

Data Engineering, Analytics, and Applications
Data application development
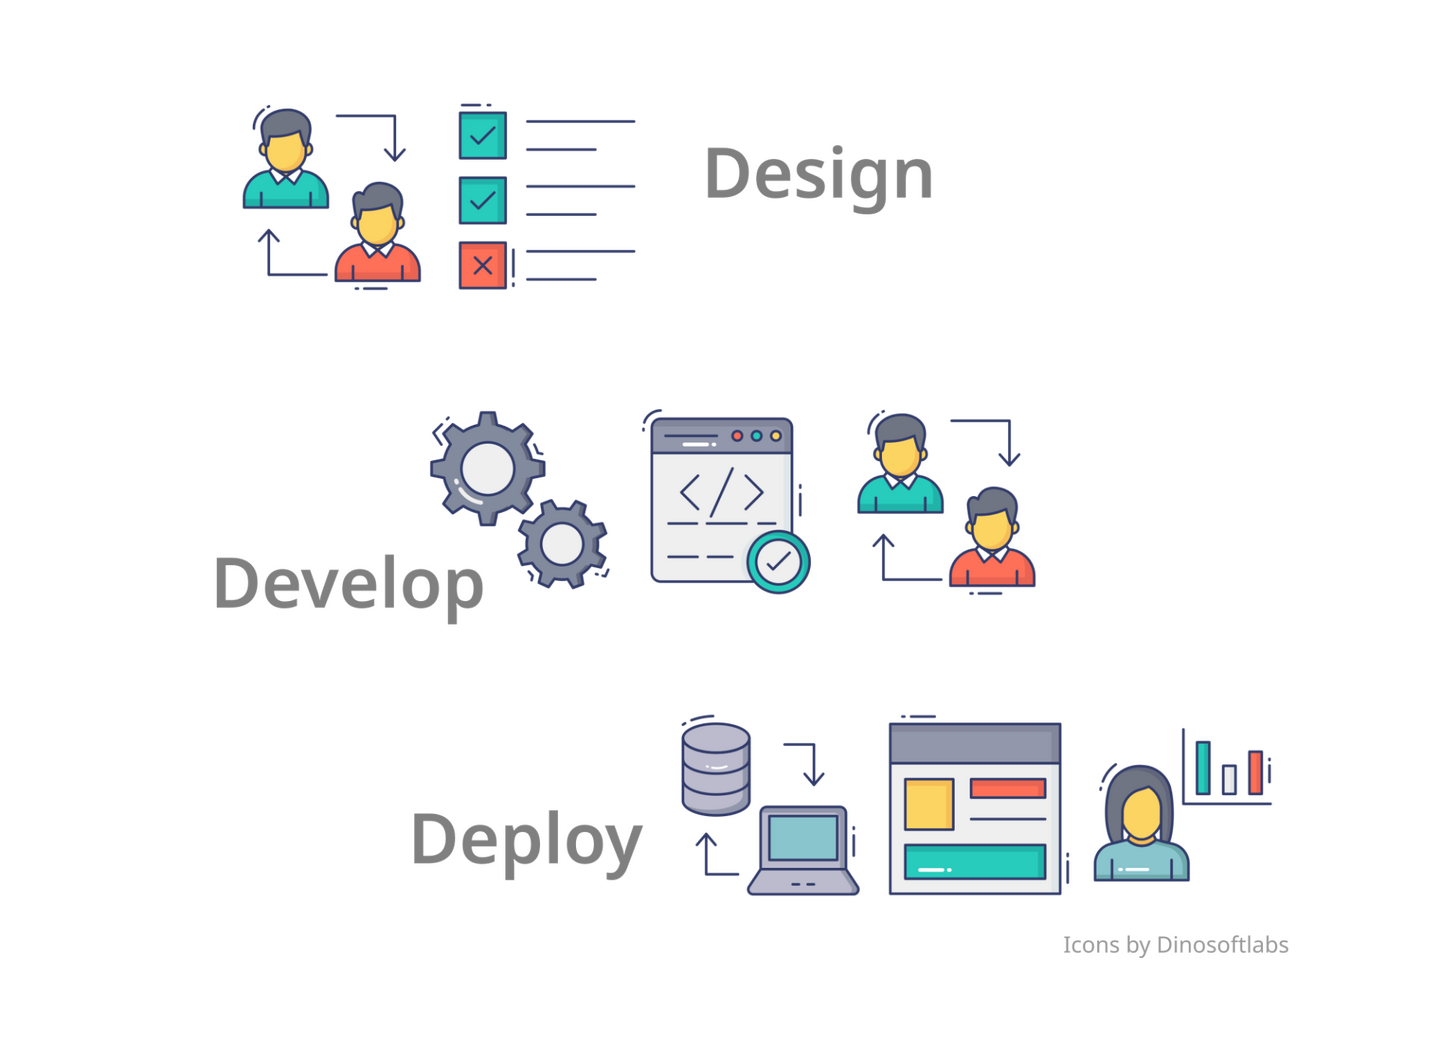
Modularized, packaged, and containerized R/Shiny web applications. We will engineer your idea into a production-ready app from scratch or evaluate and optimize existing code to make it ready for production and sharing.
Statistical analyses
R is the premier statistical computing environment with unparalleled resources for any statistical procedure and a vast universe of contributed, specialized tools. We can help you leverage this powerful analytical platform by abstracting away the complexity and devising a best-fit solution.
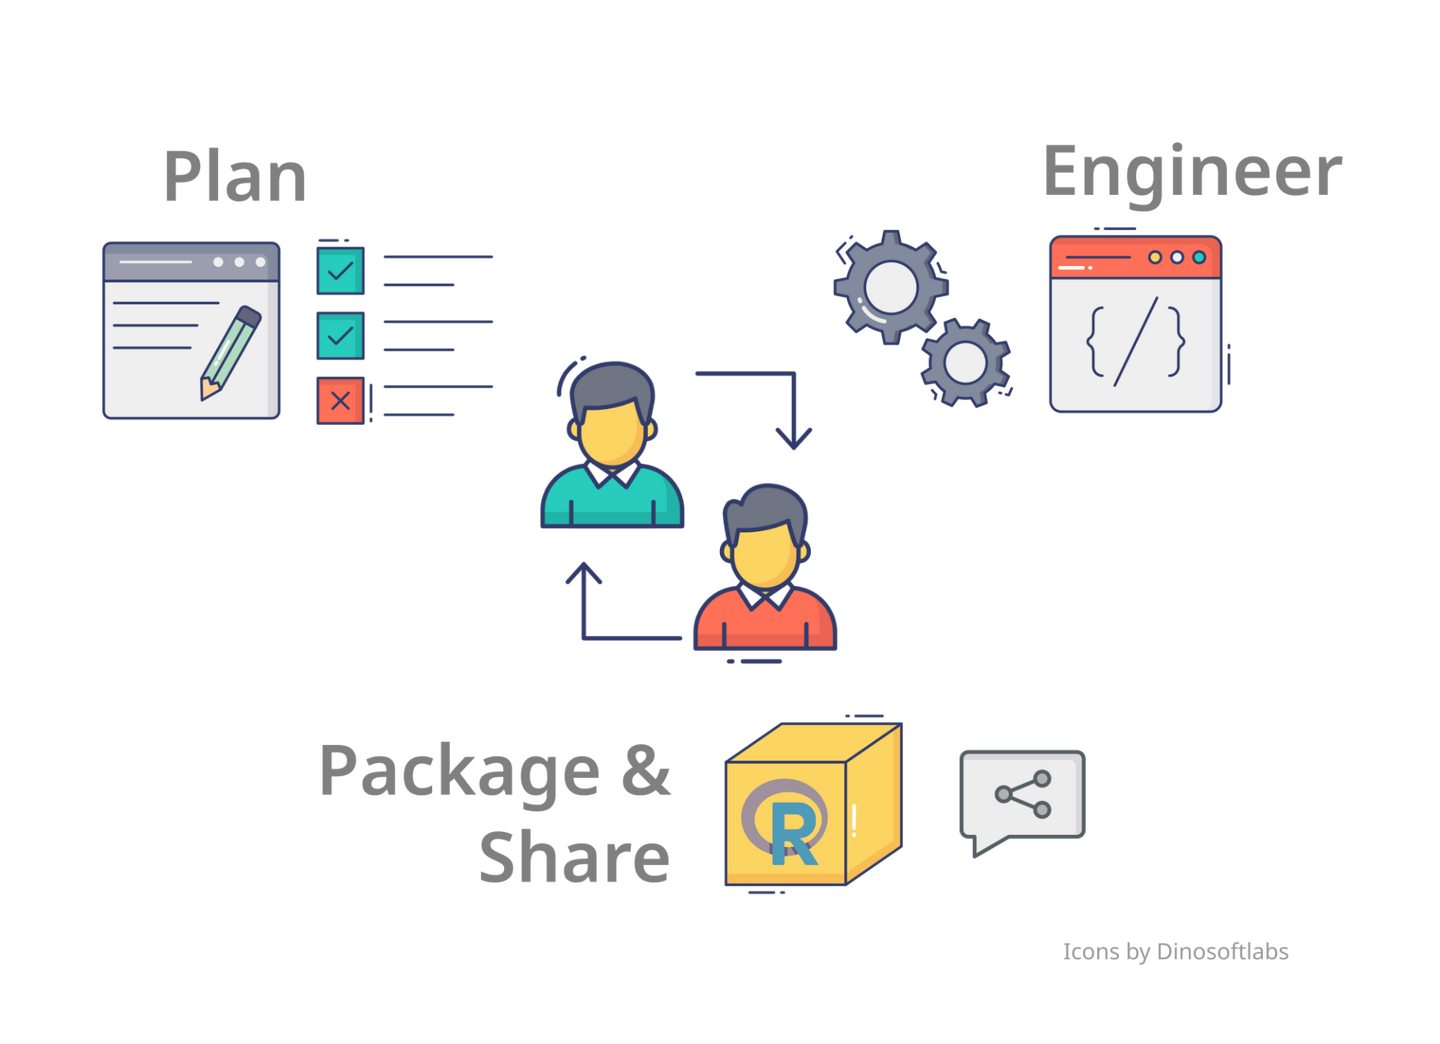
R package development
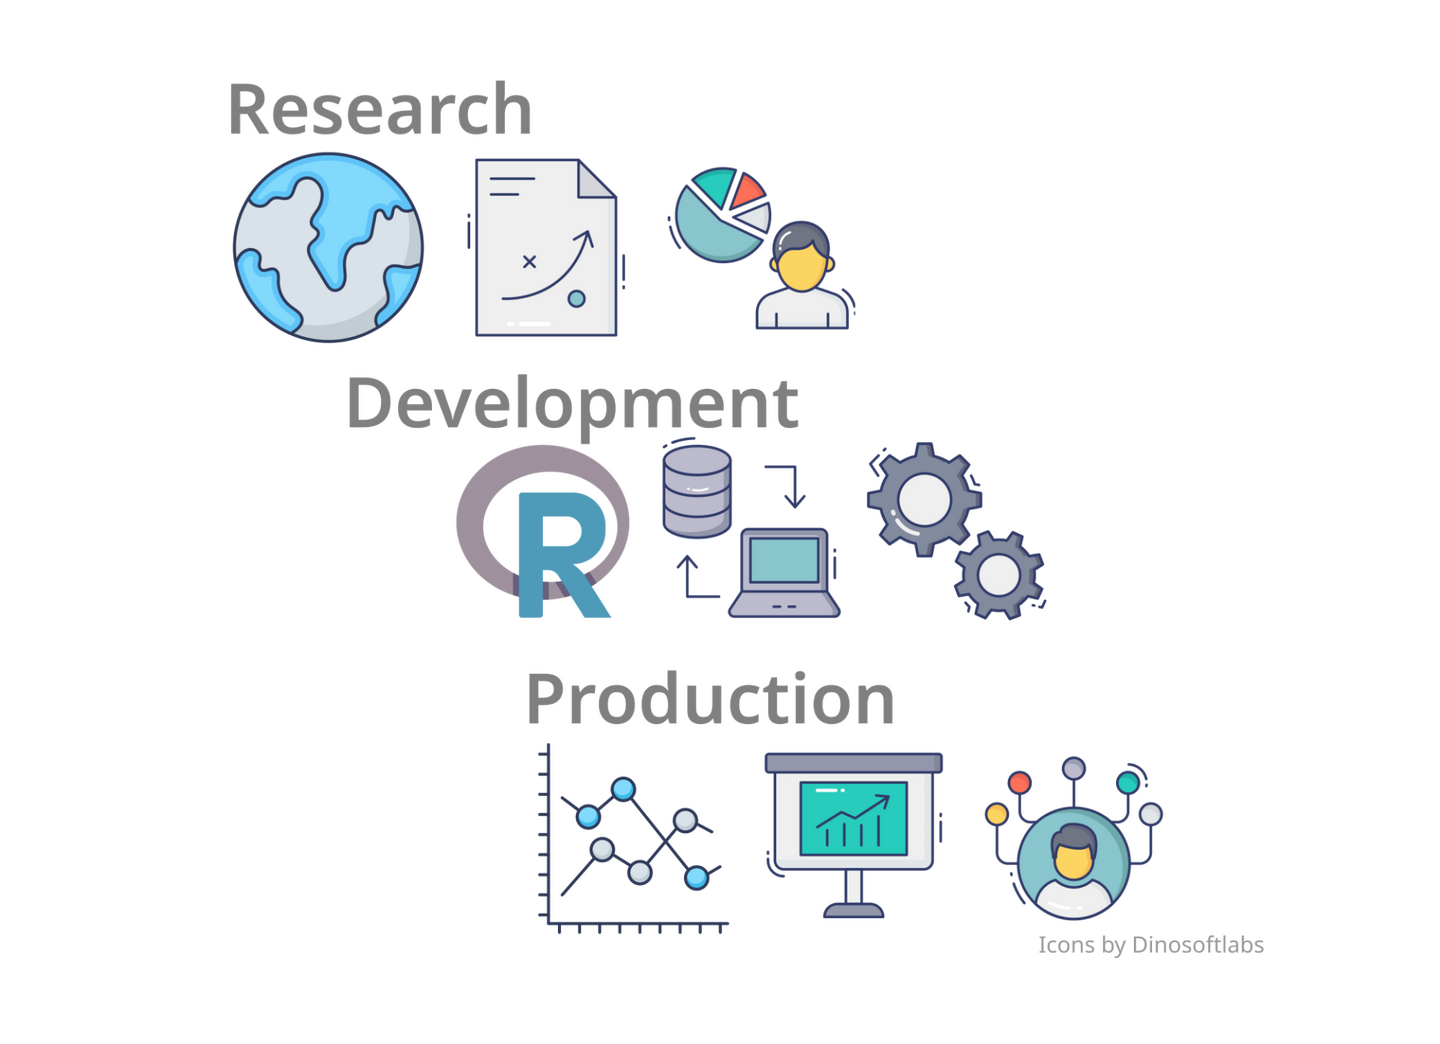
We specialize in writing R packages and can help you automate a manual workflow, streamline and optimize analytical pipelines or convert spreadsheet workbooks into fully-fledged, documented R packages ready for CRAN, Bioconductor, or GitHub.
Bioinformatics
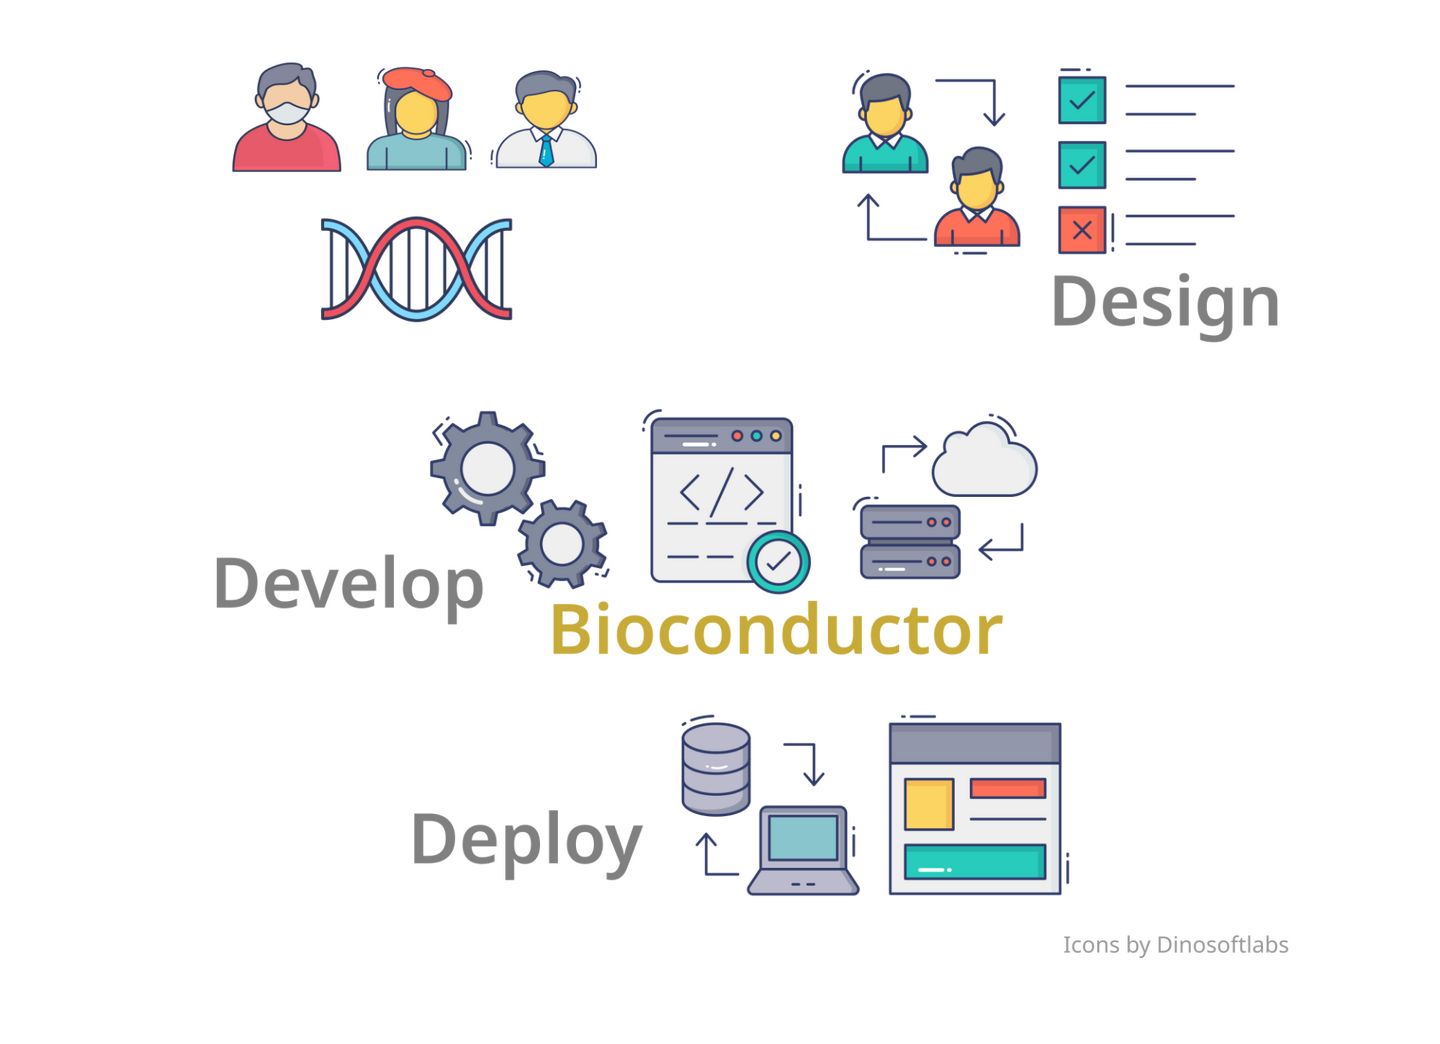
We have 12+ years of experience with analysis of DNA and RNA and great understanding of the Bioconductor analytical and development stack. We can help with various aspects of your sequence analysis projects, from investigating and prototyping a protocol, to optimization of pipelines for production.
Data visualization and dashboards
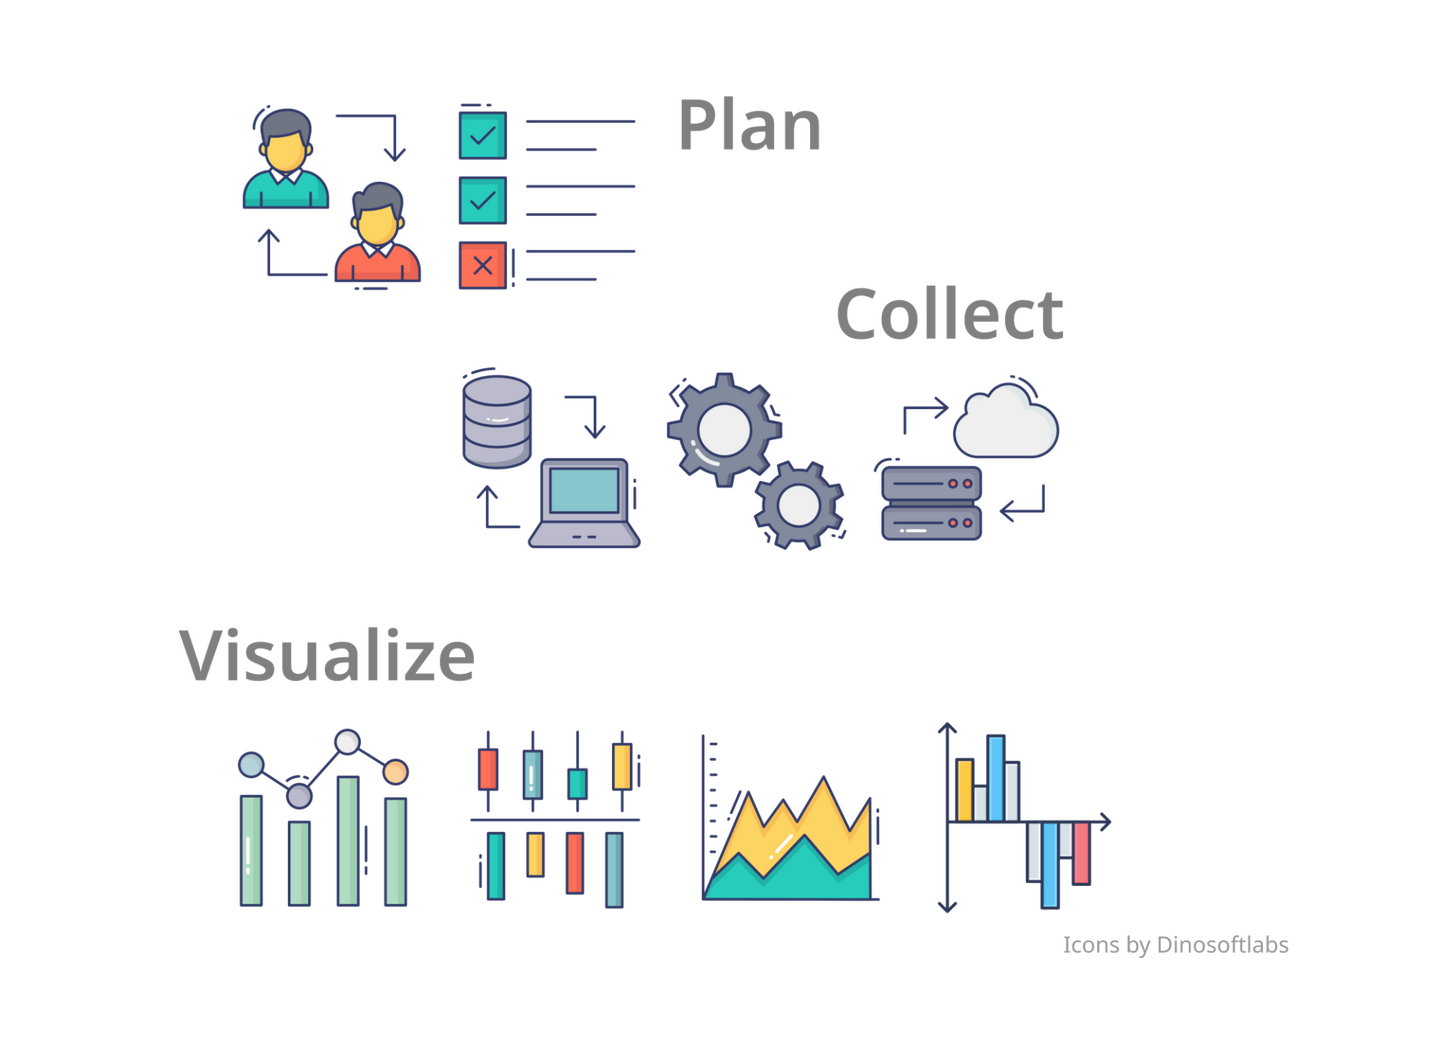
We have 20+ years of collective experience in wrangling, aggregation (including temporal and spatial), and charting data from the biology, medicine, geography, climatology, and business sectors. Our visualization toolkit includes: ggplot, plotly, leaflet, tmap, DT, gt, rhandsontable.
Data extraction and ETL
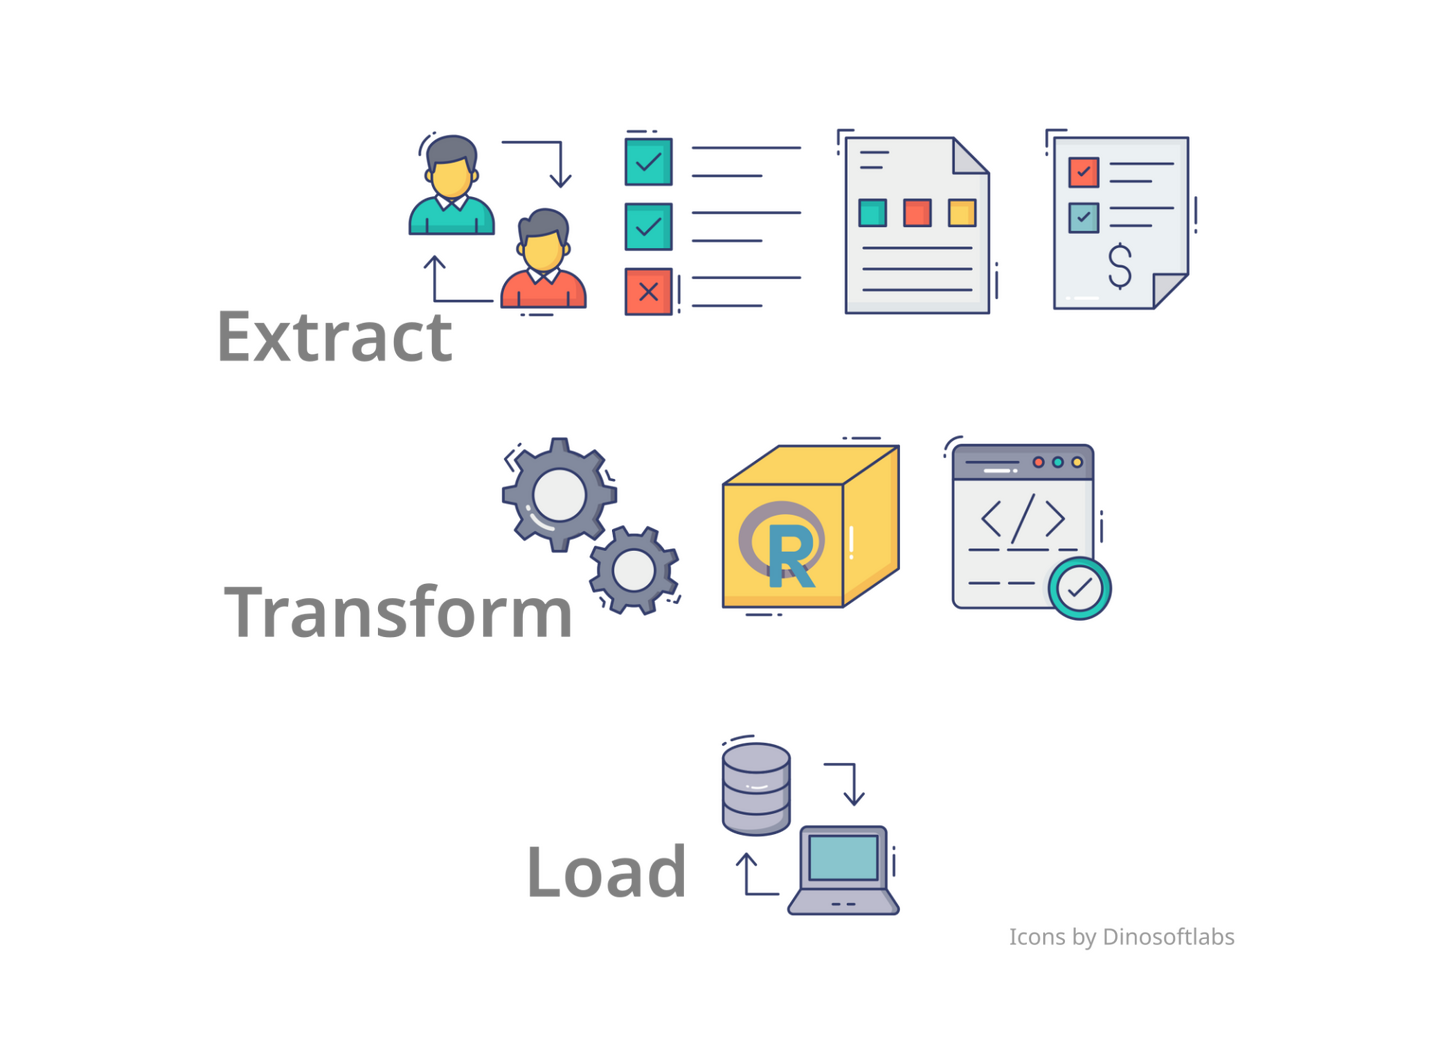
We can help you extract, clean and normalize your data from a variety of sources into a unified, centralized location, be it a relational SQL database in the cloud or a local data model package.

Team
You?
We are always open to collaborations and people to join our team. Whether that is to build an open-source project (we maintain or contribute to several projects in the R ecosystem) or to work with clients, there are opportunities that we would very gladly discuss with you.Do not hesitate to contact us.

We'd love to hear from you!

Our Clients' Feedback
"... superb collaboration skills ... Highly recommended for start-ups who need someone reliable to do the job efficiently."Evopricing.com (Upwork client)
"Exceptional, candid, honest, very rapid, accurate, detailed and direct communication. Excellent work, finished on time."Casualmap.app (Upwork client)
"... sound, practical, independent advice. ... Our industry is very niche, and they took time to understand aspects of it. Much appreciated!"Facit.org (Upwork client)
"... absolute professional and a pleasure to work with. ... delivered our project on time and on budget. ... you won't be disappointed!"(University of Newcastle, Australia)

Our Recent Projects
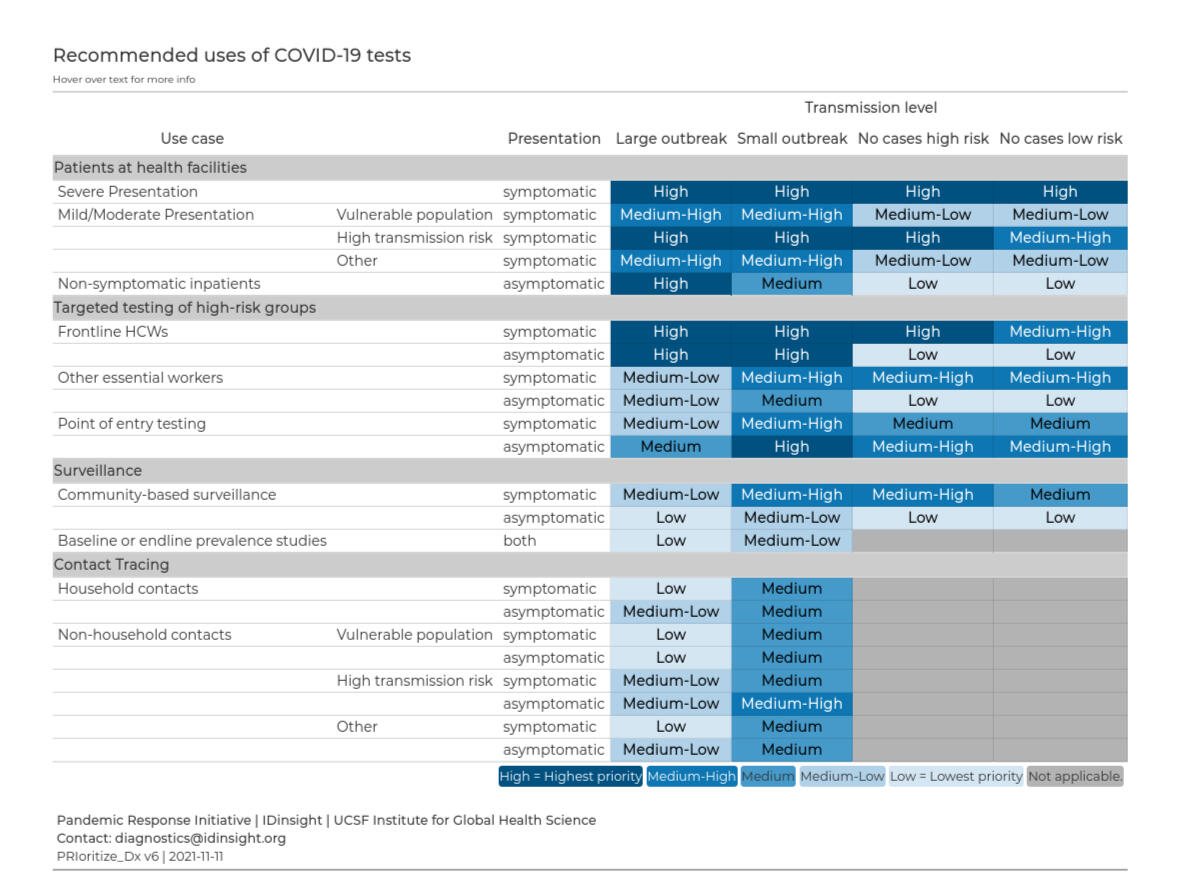
A web application to help health policymakers determine the best ways to use limited COVID-19 tests
IDinsight teams in the US and East Africa had developed a complex MS Excel utility to optimize the use of Covid-19 testing resources. Their tool would take inputs regarding the conditions in a particular area (outbreak size, mask-wearing, social distancing, accessibility, availability of tests, etc.) and would make recommendations for the best use of the PCR test kits. Our role was to convert this workflow, that was difficult to grow and maintain, into a Shiny web application equipped with a Google Analytics module to track the app's usage across countries and through time. Visit the app.
Tags: COVID-19, R, Shiny, DataTables, jQuery, Google Analytics, GitHub, Git
An R package for epidemiological modeling of COVID-19 outbreaks
Our clients, a research team from Japan and Australia, had developed an epidemiological mathematical model to predict the course of an COVID-19 outbreak under various demographic conditions. Although their setup with MS Excel was sufficient for model development and testing, they required a more robust solution for publication, validation by the peer community, and use in production. The work was somewhat time sensitive, as this was in the early days of Covid-19 (2020) in many countries, so we needed to work fast to get the research and modelling tool out to the community as fast as possible. Discindo's contribution was to develop the R package within one week complete with extensive documentation, usage vignettes, and website. This facilitated quick testing of the model in a wide variety of scenarios and assumptions as well as publication of the research and sharing of the R code in the research community.
Tags: COVID-19, R, Microsoft Excel, Mathematical Models, Epidemiology, Biology
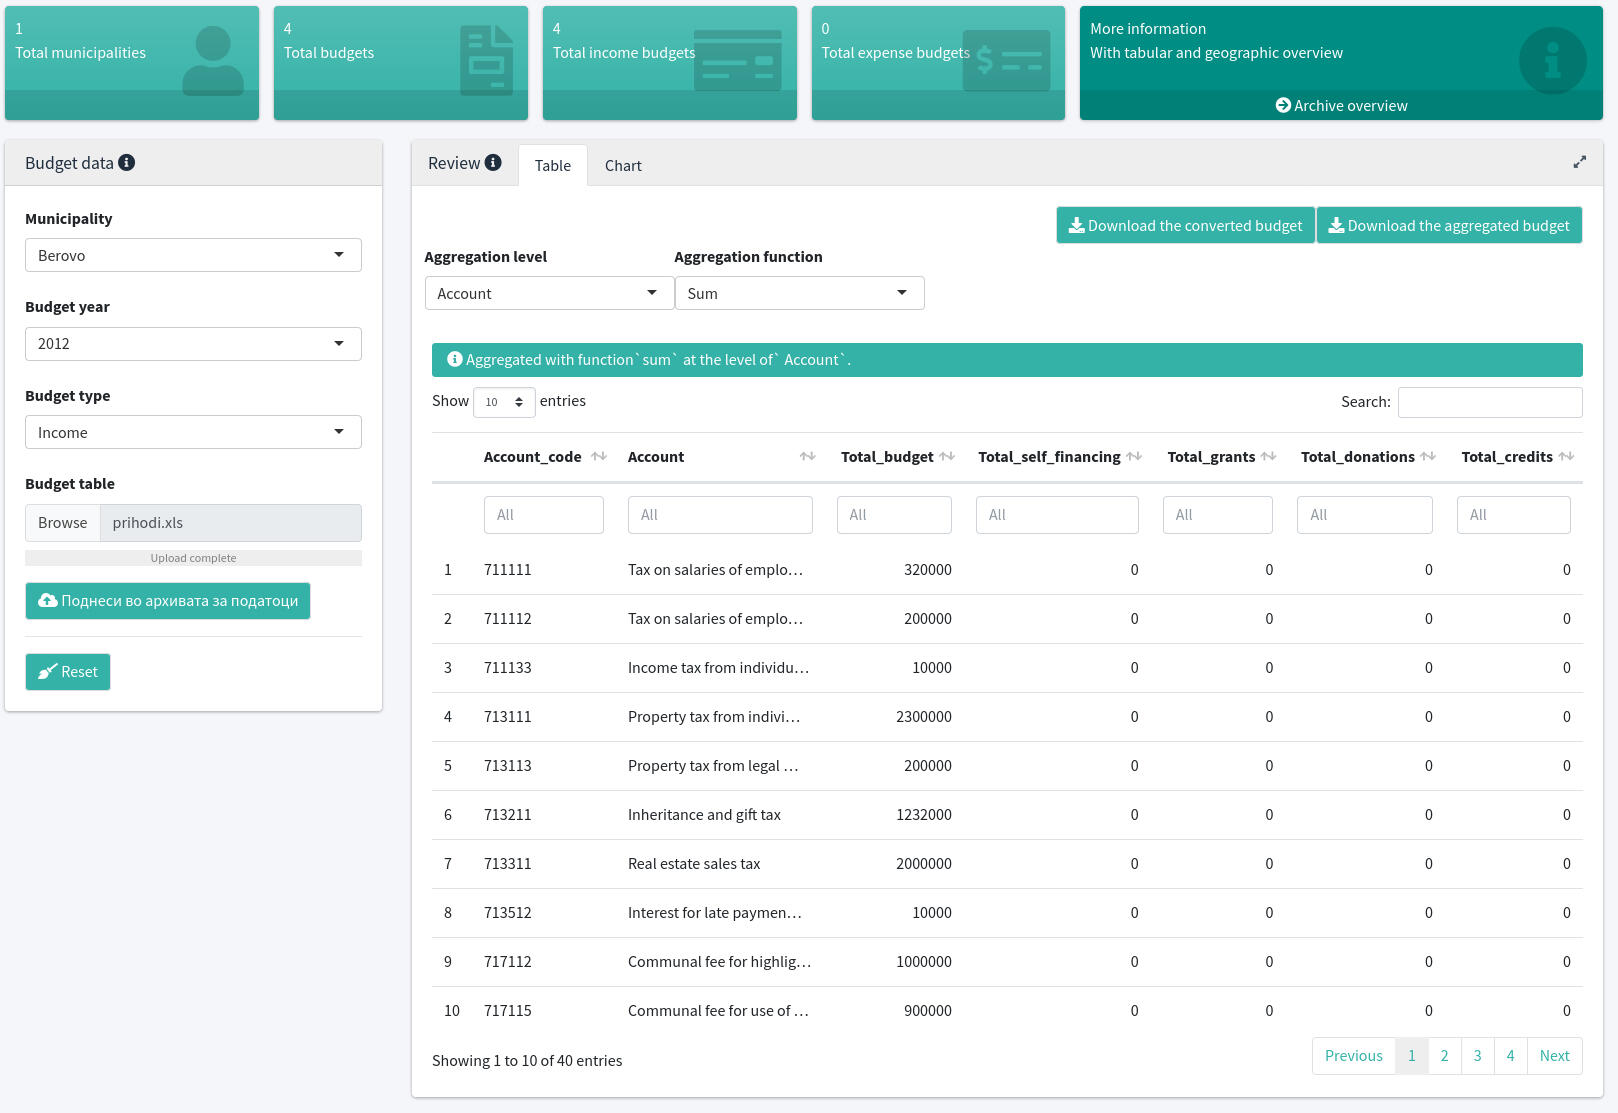
A trilingual web application for local government budgets in North Macedonia.
The Metamorphosis Foundation,
organized an open data hackathon, inviting proposals for applications that would help "open" data generated, collected, and stored by the government in North Macedonia. We proposed an application that would allow uploading, converting, aggregating, analyzing, and archiving budget data for local governments (municipalities). We based our workflow in R and Shiny, leveraging R's blossoming toolkit for data wrangling and analytics, on the one hand and the ever-improving performance and scalability of Shiny, on the other. Visit the app.
Tags: R, Shiny, Open Data, Local Governments, Budget Transparency


